


Core Web Vitals describe three experiences people have while using a page: when its main content appears, how quickly it responds to an action, and whether the layout moves unexpectedly. A useful audit starts by locating the pages and actions that cause trouble. A WordPress store may have different problems on its homepage, product templates and checkout. Testing only the homepage can miss delays on the screens that matter most to shoppers. This guide shows how to read PageSpeed Insights, confirm the likely cause in a browser trace and validate a fix before and after releasing it.
What LCP, INP and CLS measure
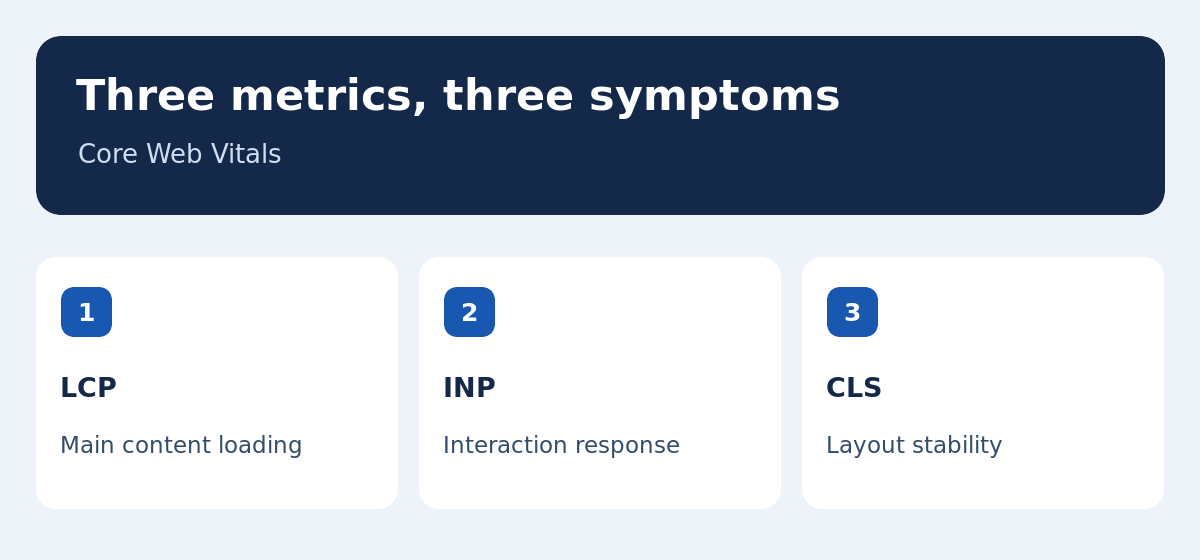
Largest Contentful Paint, or LCP, describes when the largest qualifying piece of content in the viewport is rendered. Interaction to Next Paint, or INP, describes responsiveness to interactions over the visit. Cumulative Layout Shift, or CLS, captures unexpected visual movement. The recommended good thresholds are at most 2.5 seconds for LCP, 200 milliseconds for INP, and 0.1 for CLS. A field assessment uses the 75th percentile of available observations. The web.dev guide to Core Web Vitals thresholds explains how they are derived. Think of the three metrics as signs of different defects. A fast-loading page can still lag during checkout or move a button while someone is trying to tap it.
Read field and lab results for different purposes
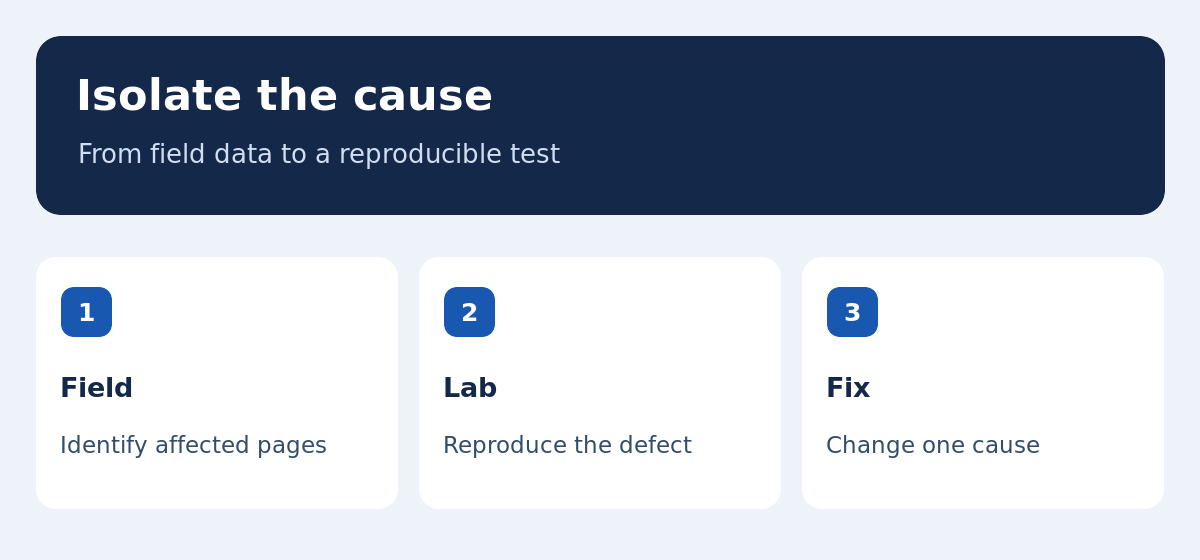
In PageSpeed Insights, check the field result when it is available. Confirm whether it represents the exact URL or the origin. Origin data combines eligible pages under the same protocol, host and port, so it can highlight a site-level trend without identifying the template that caused it. Use a lab test to reproduce symptoms and inspect which requests, scripts or rendering steps took time. A normal lab loading test does not record the variety of actions actual visitors take throughout a session. Capture several comparable runs to reduce the chance of reacting to a single unusually slow or fast result. Keep a record of the settings so another editor or developer can repeat them.
Create a baseline for pages and user actions
Choose representative URLs for important templates and write down each action you want to test. For a store, open a gallery, change a variant and add a product to the basket. On a publishing site, try opening the menu and reading an article with an embed. Record browser, viewport, network profile, cache state and test date. Keep the URLs and test conditions stable as you work through the problem. A warm cache can hide the cost of a first visit, so note separately when you are testing a repeat visit. Include a mobile device or profile if mobile traffic matters. The point is to give each performance observation a specific page and task.
Diagnose LCP by finding where the time is spent
Find the LCP element and inspect the time before the first response, the delay before its asset starts loading, the transfer and the delay before rendering. A hero image can stay slow even after compression if it is discovered late. Check whether it is a CSS background, loaded by script, or marked for lazy loading. Check that it is sized for the viewports you actually serve. If the largest element is text, inspect dependencies such as styles or fonts. Test one change, then compare the trace against your baseline. Preloading several assets without checking what competes for network capacity can delay the resource you were trying to speed up.
Debug INP on the actions users actually perform
An interaction can feel slow because the browser is busy before it processes the event, because the event handler takes time, or because rendering takes time after the handler. Reproduce the action under representative conditions and record a performance trace. If opening a menu feels slow on a phone, check which work happens between tapping and seeing the menu. A plugin or third-party script may be running at the same time. A handler may update more of the interface than the action requires. Test changes in a copy of the site and recheck dependent functions, particularly consent, menus and forms. A faster trace is useful only if the interaction still works for the person using it.
Reduce CLS by planning where content will appear
Look at the frames around a shift and find what changed size or arrived late. Common cases include a gallery without image dimensions, an embedded video without a reserved box, or a banner inserted above content already visible. Give images or embeds a known aspect ratio or reserve a suitable container. Test long translations and fallback fonts as well as normal text. A header that fits the English label may wrap when the French label loads or when the user zooms in. Test the resulting layout at the supported widths. Avoid resolving a shift by hiding an essential action or changing its position after visitors have learned where to find it.
Prioritize defects by reach and likelihood of regression
A modest improvement on a template used by thousands of readers can be more useful than a large improvement on one seldom-visited page. List the page families, the users affected, the ease of reproducing the defect and the risk of a functional regression. A specific problem with a clear cause is a better first test than a series of generic speed changes. Save a before trace and describe the action in plain language. That lets a colleague check whether they see the same issue. Leave yourself a way to undo the change and give the experiment a clear success criterion before comparing the results.
Worked example: a slow, shifting product gallery
Suppose a mobile product page lazy-loads its main photo and fills an empty carousel with thumbnails after the rest of the page appears. The trace shows a late LCP and movement when the thumbnails load. Confirm that the main photo is the LCP element at the relevant viewport size. On a test copy, exempt only that photo from lazy loading and repeat the same run. Then reserve space for the carousel using a suitable aspect ratio. Recheck the layout with different products and confirm that the gallery, zoom and variant selection still work. Run the scenario under a slower connection as well. The baseline and traces show which change affected which symptom. Field data can then show whether the effect is visible across real visits.
Verify changes before and after deployment
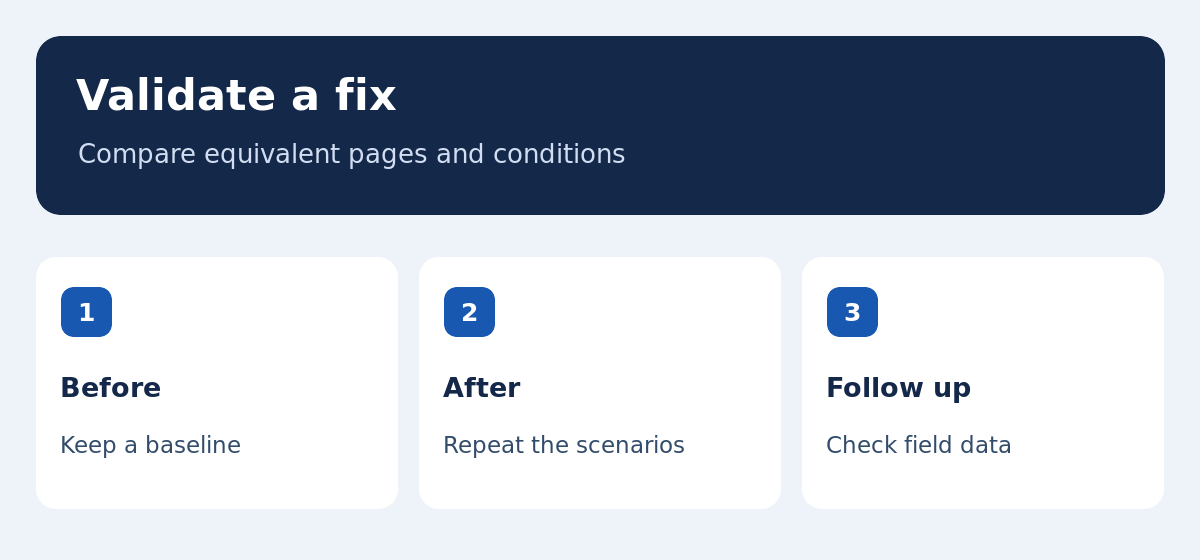
Before release, repeat the original scenarios and check related functionality. If you changed script timing, verify tracking, purchase and form behavior as appropriate. After release, confirm that the affected template and its critical resources still load as expected. Leave time for field data to reflect the new version. If the site gains more mobile traffic after the release, review mobile and desktop separately before judging a change in the combined result. Keep a dated note with the affected templates, tested routes, traces and any metric trade-offs. That record helps the team investigate changes after a theme or plugin update without starting again from scratch.
Connect website performance with the rest of SEO
Performance is part of a usable page. Check indexing, content quality and internal navigation alongside it. A technically fast page can still be hard to discover if the main directory has no working link to it. Use our SEO starter guide to check access and indexing, and the rank tracking guide to interpret search changes. For multilingual sites, verify the French and English URLs independently even if they use a shared design. A different hero asset or longer menu label can create a different performance problem on the other version.
When should you run the checks again?
Repeat the core scenarios after theme changes, major plugin updates or a change to a storefront service. Add a check when you introduce a new media type, promotional banner or checkout step. You can use the same small page set for routine checks and only expand the audit if a trend affects additional templates. Note the time, device and network for each run, and compare only results that used equivalent settings. If a problem recurs at certain times, run multiple checks and record the pattern. This makes the audit a maintenance habit rather than a one-off report.
What if there is too little field data for a new page?
Keep a reproducible lab baseline and check whether a similar page on the same template has usable field data. Use the comparison to form a hypothesis, then test the affected page directly. If the template is shared, review the assets, extensions and text that are unique to the new page. For a translated article, the source page can suggest where to look, but the exact image and menu content may differ. Write down what evidence would cause you to revisit the decision once more visits have been recorded.
Know when the bottleneck may be server response
If several templates are slow before their images and scripts even start loading, inspect the initial response and any redirects. Compare a cacheable article with a session-dependent page such as a basket. A configuration that benefits one template may not be appropriate for the other. Inspect request timings and headers, and check how much of the delay occurs before the first response. On a bilingual site, test each direct locale URL as well as navigation through the language switcher. An extra round trip on a frequently used path can change the visitor’s experience.
Check for trade-offs between metrics
Retest the other vitals after fixing one issue. A faster image can still shift surrounding content if its dimensions are missing. A change to caching can speed up the first render but leave outdated information after a user action. Trace the full task, especially cart updates, language changes and submissions. Agree on which behavior must remain correct and record any known trade-offs. The score is a diagnostic signal. The primary evidence is whether a familiar task reliably works on the pages people use.